
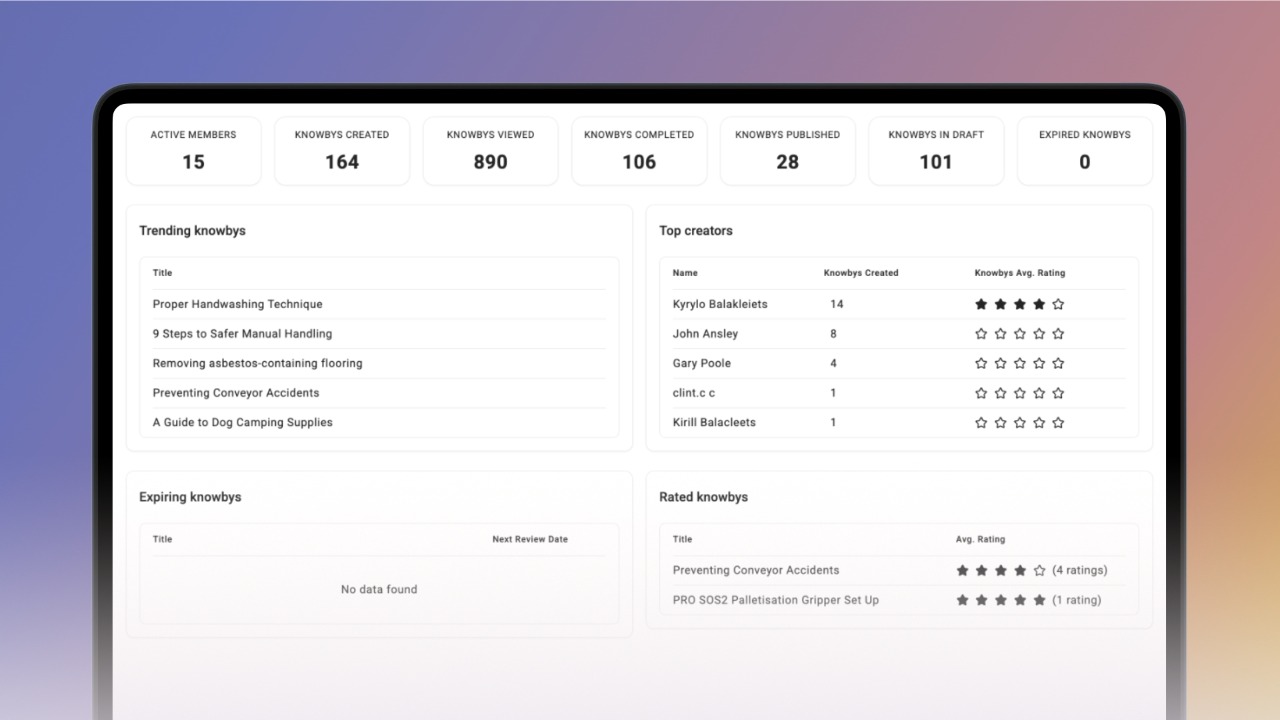
Reporting shows you how your knowbys are performing — who's viewing them, who's completing them, and what needs attention.
Open Settings, go to Reports, and click Open reports to reach the dashboard.
📱 Reporting is available only to Admins on desktop.
Reporting has two parts: a navigation panel on the left, and your analytics on the right.
Start on the Dashboard tab for a high-level view.
Click the calendar button to set a custom date range — you can adjust the day, month, and year. Everything on screen updates to match the dates you choose.
💡 Pick both a start date and an end date, so the period shows correctly.
In the Organisation section, alongside the Dashboard, you'll find:
Completions — an overview of all completions in the selected date range. Click View in the table to see each one in detail.
Next Review Dates — knowbys that have a Next review date set in their Optional Settings.
Ratings — an overview of all your organisation's knowby ratings.
Updates — a record of knowby update activity across the organisation.
Views — all knowby views in the organisation.

Data export lets you download a ready-to-use Excel workbook — open it and click Refresh for live data.
Access token — a read-only access token is created automatically the first time you download a workbook, and embedded in the file.
Excel workbook — one sheet per table, wired to your data with your token embedded. Open it and click Refresh. No data is stored in the file.
The Knowby, Member, Team, and Category sections let you view Completions or Views for a single knowby, member, team, or category.
Use the dropdown to pick the one you want, and see its data for the selected period.
To export any table, click the download icon in its top-right corner and save it as a CSV — ready to share or analyse in your own tools.
To head back to your knowbys on the home screen, click the Home button in the top-left corner.